
LossGuardian guide
The Dashboard
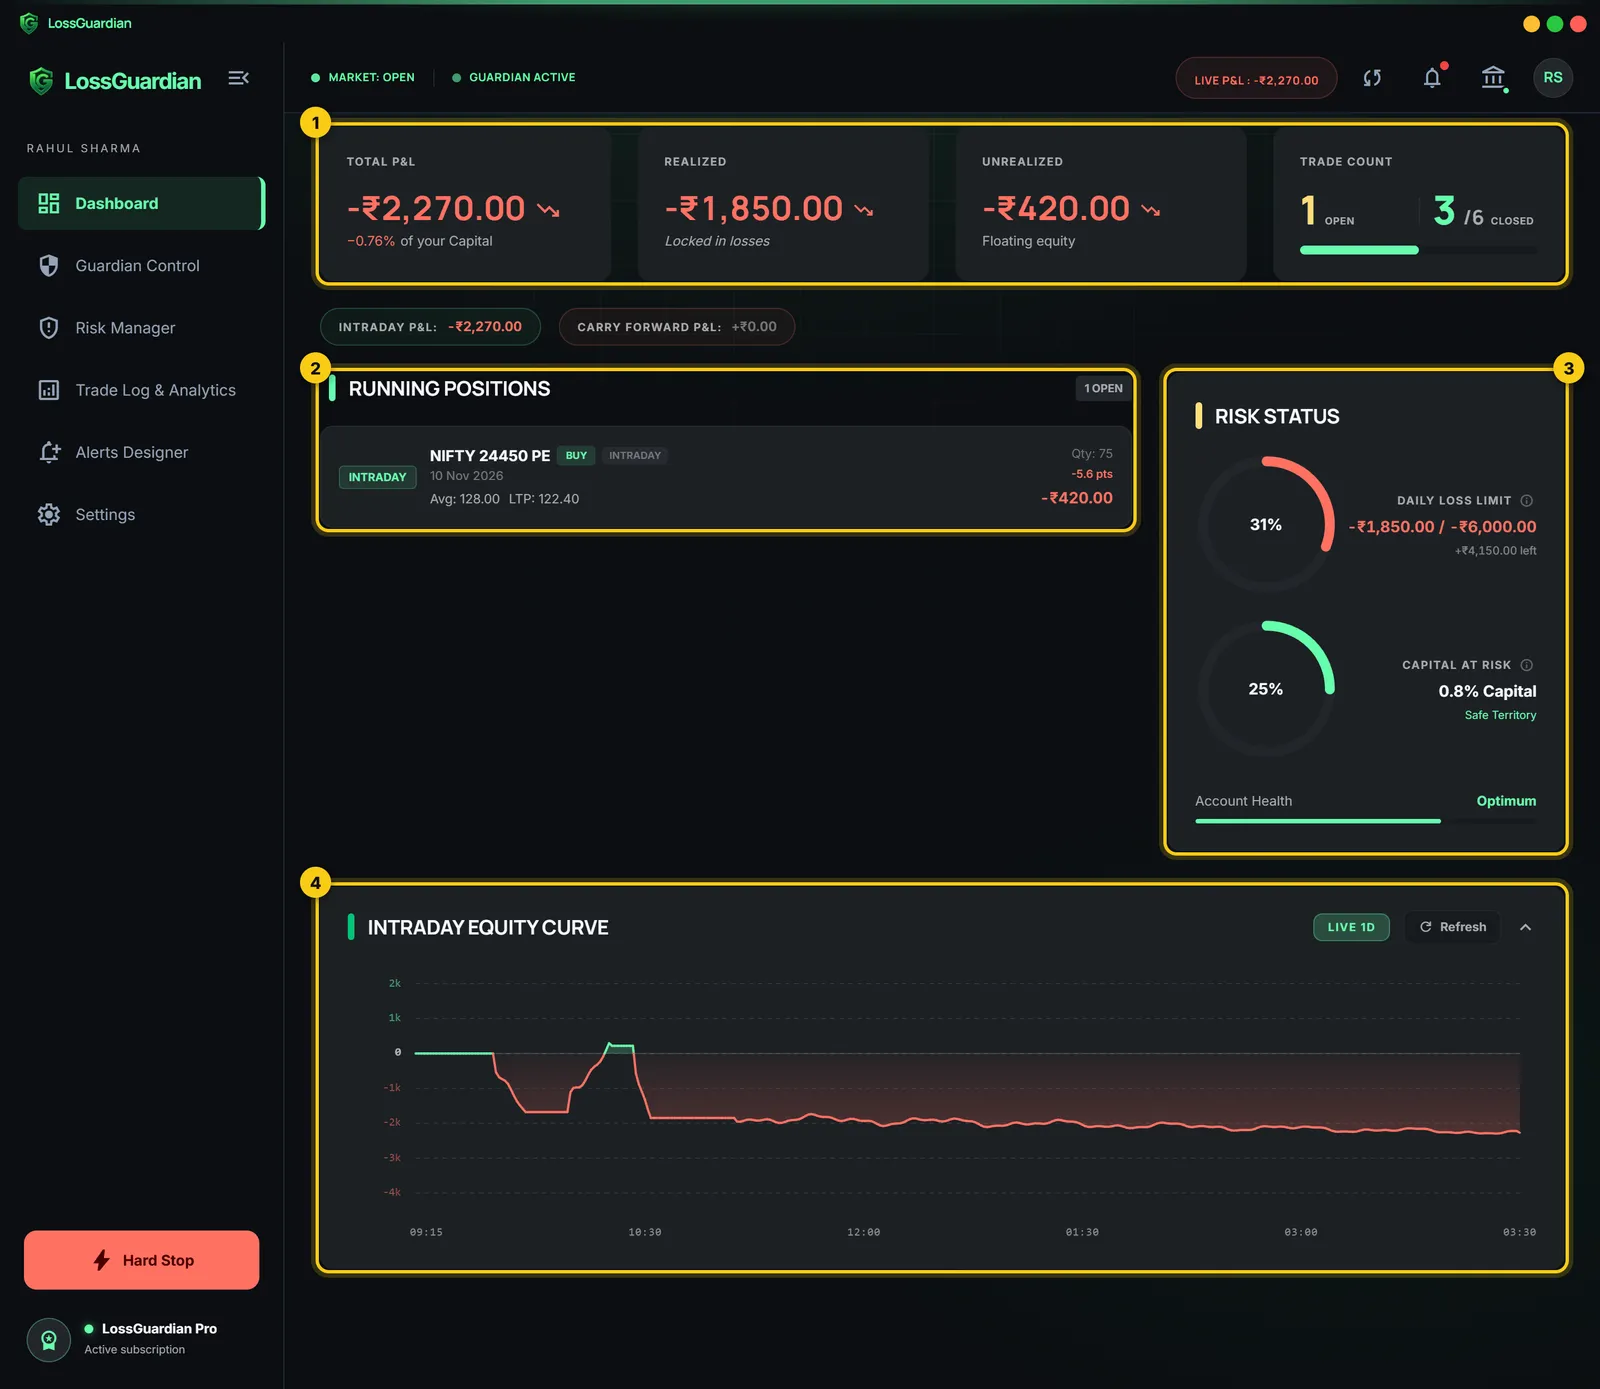
The Dashboard is your trading day at a glance. It reads your positions from your broker as they change, and shows how close you are to the limits you set. If you only look at one screen during the day, make it this one.
What each part shows
- 1
P&L and trade count. Total P&L, what is booked (realized), what is still open (unrealized), and your trades: open now, and closed against your daily trade limit.
- 2
Running positions. Every open position with its quantity, average price, last price and P&L, marked intraday or carry forward.
- 3
Risk status. How much of your daily loss limit is used, how much of your capital is at risk today, and your account health.
- 4
Intraday equity curve. How your P&L moved through the day. Open it with the arrow, and press Refresh to add the latest point.
The bar at the top shows whether the market is open, whether Guardian is watching, and your live P&L. The bell holds today’s alerts.
How to read it in five seconds
- 1
Look at the loss limit ring in Risk status. Past half? Slow down.
- 2
Look at the trade count. Close to your limit? Make the next trade your best one, or your last.
- 3
Look at the equity curve. A day that went up and came back down is a day to protect what is left.
Intraday and carry forward
The two chips under the P&L cards split your day into intraday P&L and carry forward P&L from overnight positions. Whether carry forward counts toward your daily loss limit is your choice, in Risk Manager.
Questions
How often does the Dashboard update?
Every few seconds while Guardian is running, from your broker’s positions.
Why is my P&L different from my broker app?
Brokers show P&L in slightly different ways, for example with or without charges. LossGuardian shows P&L before charges, and lists estimated charges separately in the Trade Log.
What does the Hard Stop button do?
It lets you stop for the day yourself, before a rule does. With Advanced Mode on, it opens Take a pause instead, so you can choose a short break or Done for today.