
Trading journal and analytics
An automatic trading journal that shows you the mistakes you repeat
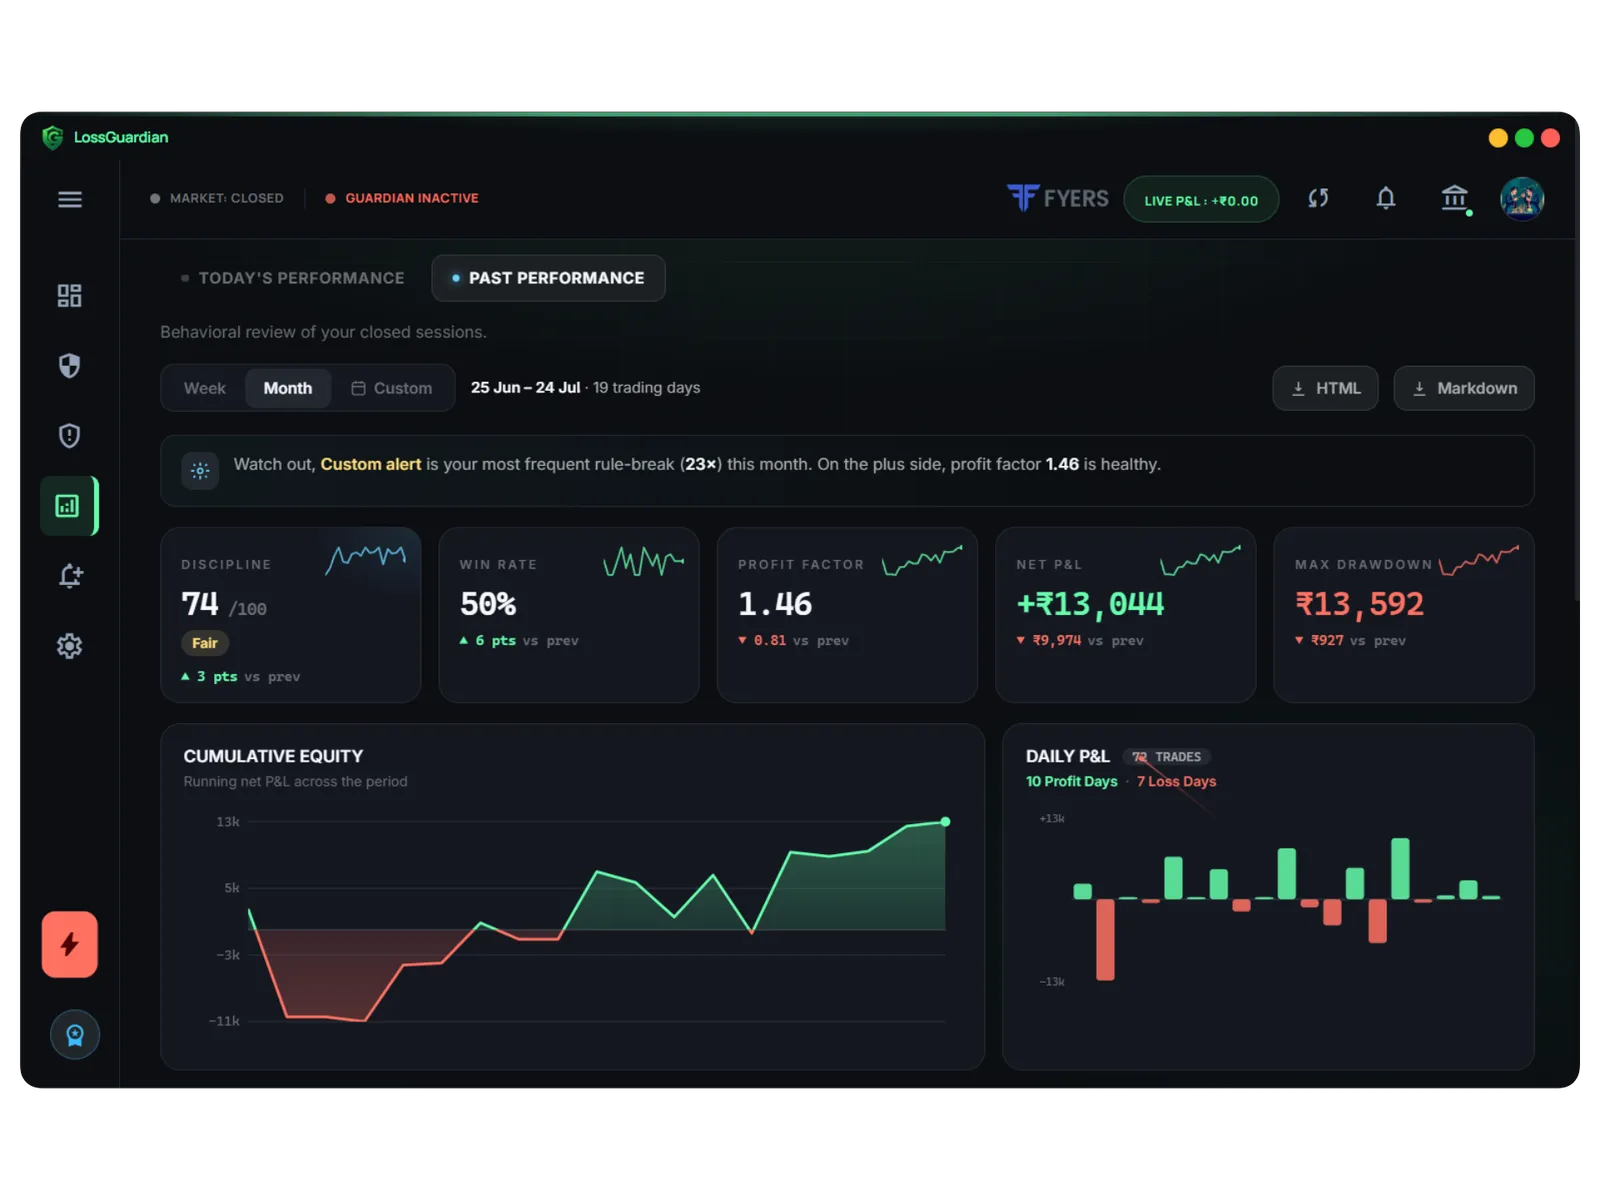
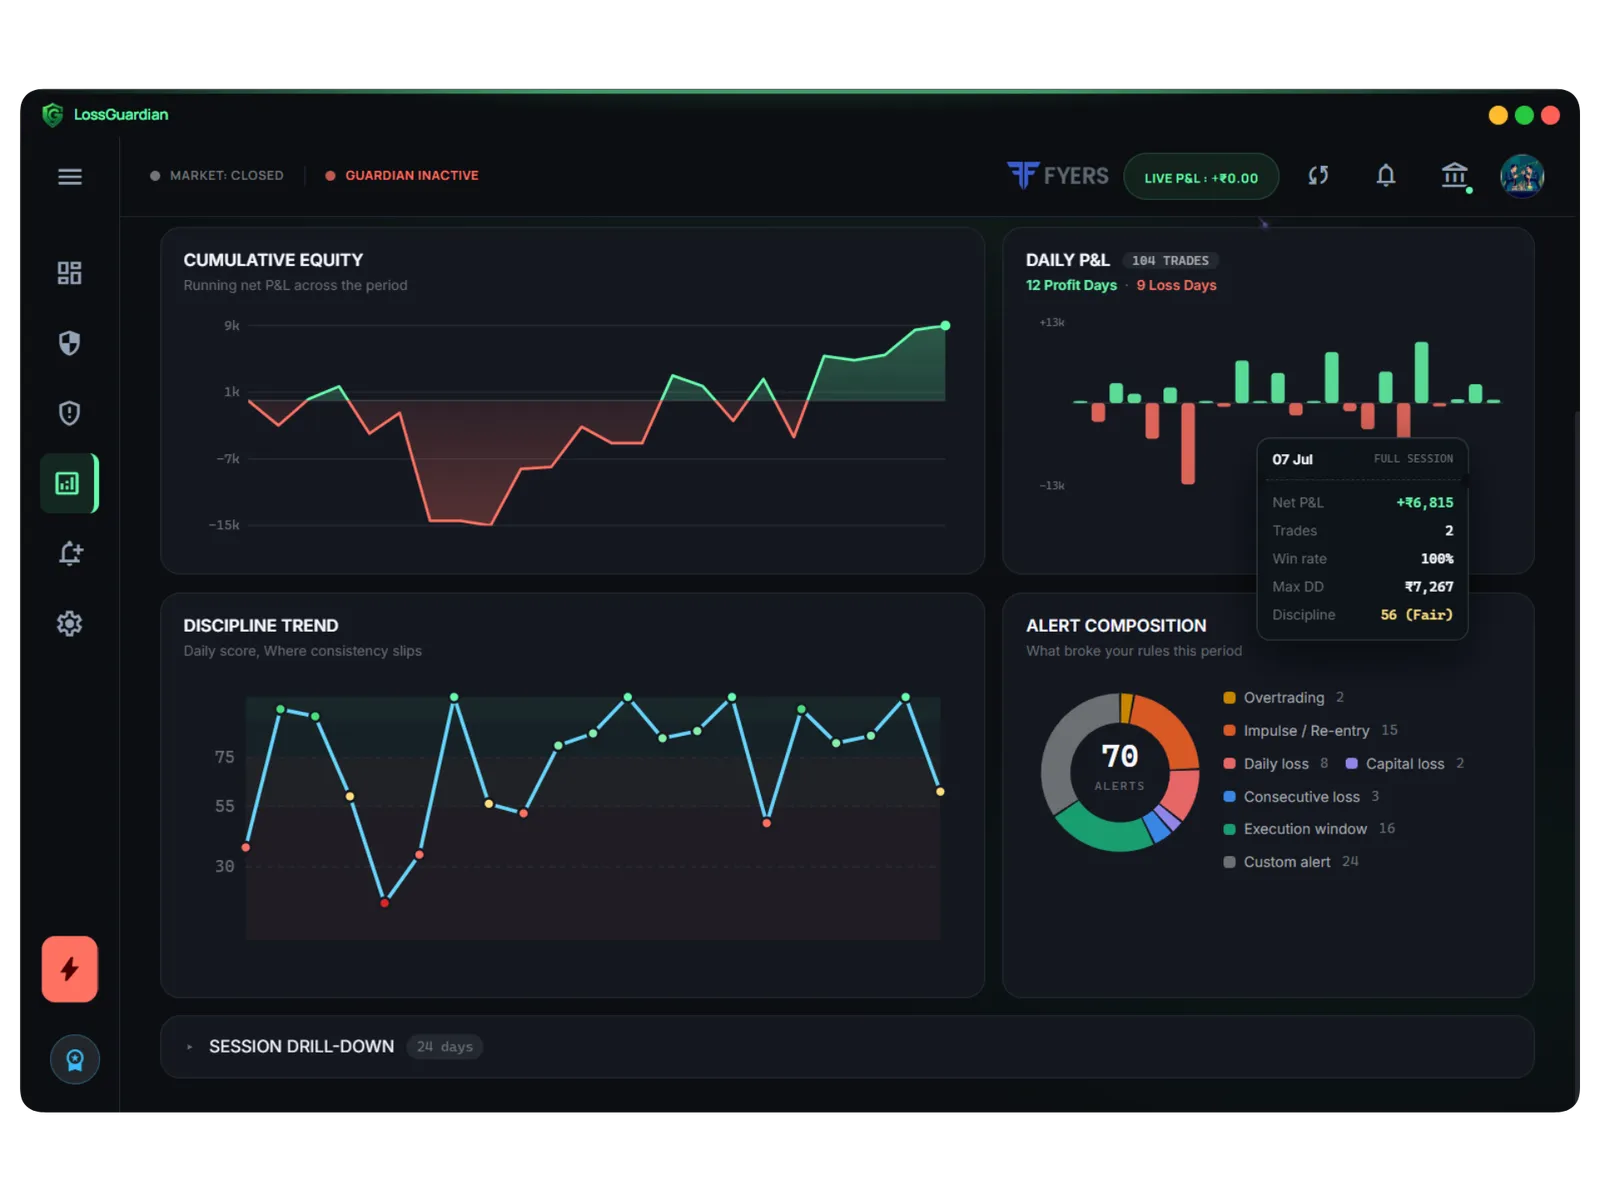
LossGuardian builds your trading journal automatically from your broker data. It shows net P&L, win rate, profit factor, max drawdown, an equity curve and a day by day drill-down, next to the rules you broke and how often. You can export any session as a file for your own journal or an AI assistant. Your data stays on your computer.
Your memory is not a trading journal
You remember the brilliant ₹8,000 trade. You forget the four small revenge trades that lost ₹9,000 the same afternoon. That is not dishonesty. It is how memory works.
Keeping a journal by hand fixes that, but it takes an hour a day. Most traders do it for two weeks and stop.
Profitable traders know their numbers. Not because they are smarter, but because they look at their data every week and fix one thing at a time.
How trading journal and analytics works in LossGuardian
- 1
Connect your broker once. Your trades come in automatically.
- 2
Pick a week, a month or a custom range and see your key numbers with the change from the last period.
- 3
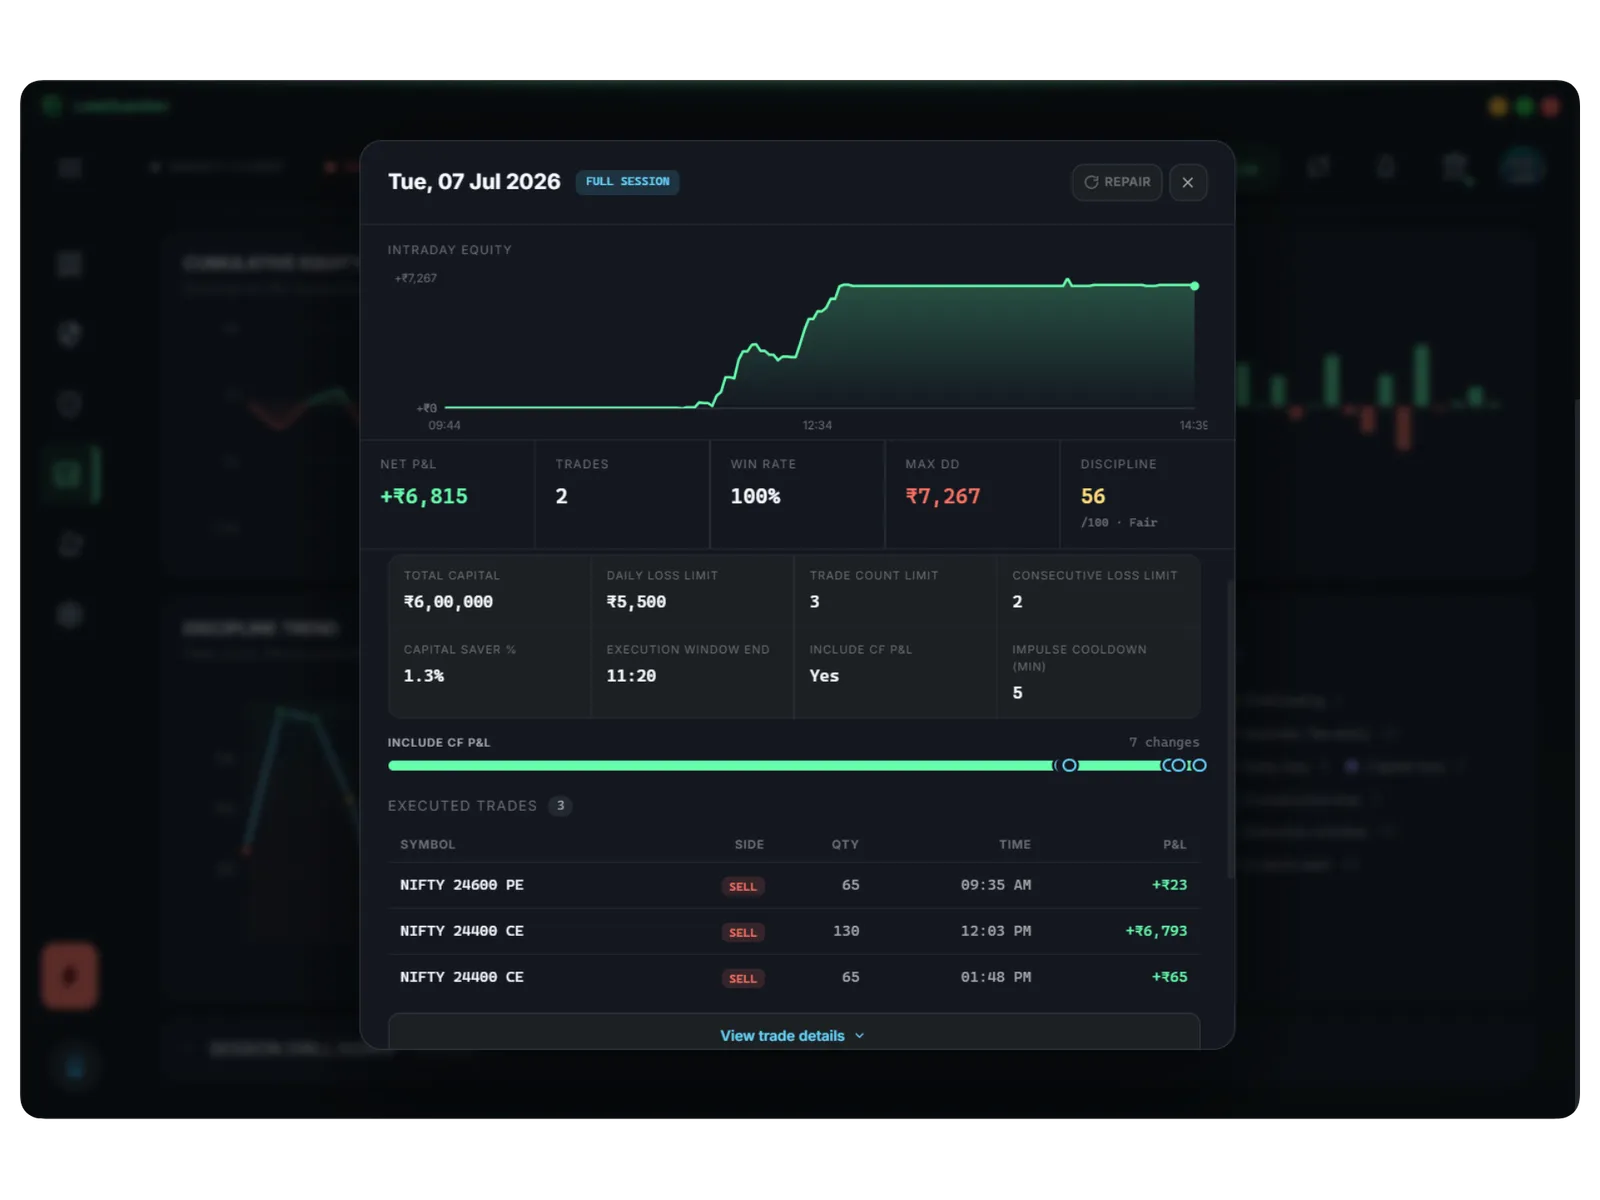
Open any day to see its intraday equity curve, every trade, and the rules you had set that day.
- 4
Export a session as Markdown or HTML for your journal, Notion, or an AI assistant to review.
The numbers that matter, explained
Two kinds of drawdown
Drawdown from closed trades, and drawdown including open positions. They mean different things, so both are shown and named clearly.
Win rate and profit factor done right
Win rate is worked out from real round trips, not just the sign of your P&L. Profit factor is total gains over total losses. Both come with a short explanation.
Rule changes are tracked
If you change a limit during the day, the day view shows it. Loosening your own rules mid-session is easy to spot afterwards.
What it is not
It is not a cloud service that collects your trades. Your history is stored on your own computer and kept separate per broker account. Nobody else sees it.
Trading journal and analytics: questions traders ask
What is the best trading journal for Indian traders?
The best journal is the one you keep using. An automatic journal that reads your broker data saves the hour a day that makes most people quit. Look for one that shows your rule breaks, not only your P&L.
What should I track in a trading journal?
Net P&L after charges, win rate, profit factor, your biggest losing day, and how often you broke each of your own rules. The last one is the most useful and the one most traders skip.
Can I export my trades for AI analysis?
Yes. Any session, today or in the past, exports as a Markdown file with trades, discipline stats, alerts and the equity curve, ready to paste into an AI assistant or Notion.
Where is my trading data stored?
On your own computer. It is not uploaded to our servers, and each broker account has its own separate history.
Read more
More LossGuardian features
See all features · Works with Zerodha, Fyers, Dhan, Upstox, Angel One and Groww