 LossGuardian
Risk strategy
Your trading data knows your mistakes. Here is how to read it
Profitable traders study their own numbers every week. What to look at in your trading analytics, what each number means, and how to fix the mistake you repeat most.
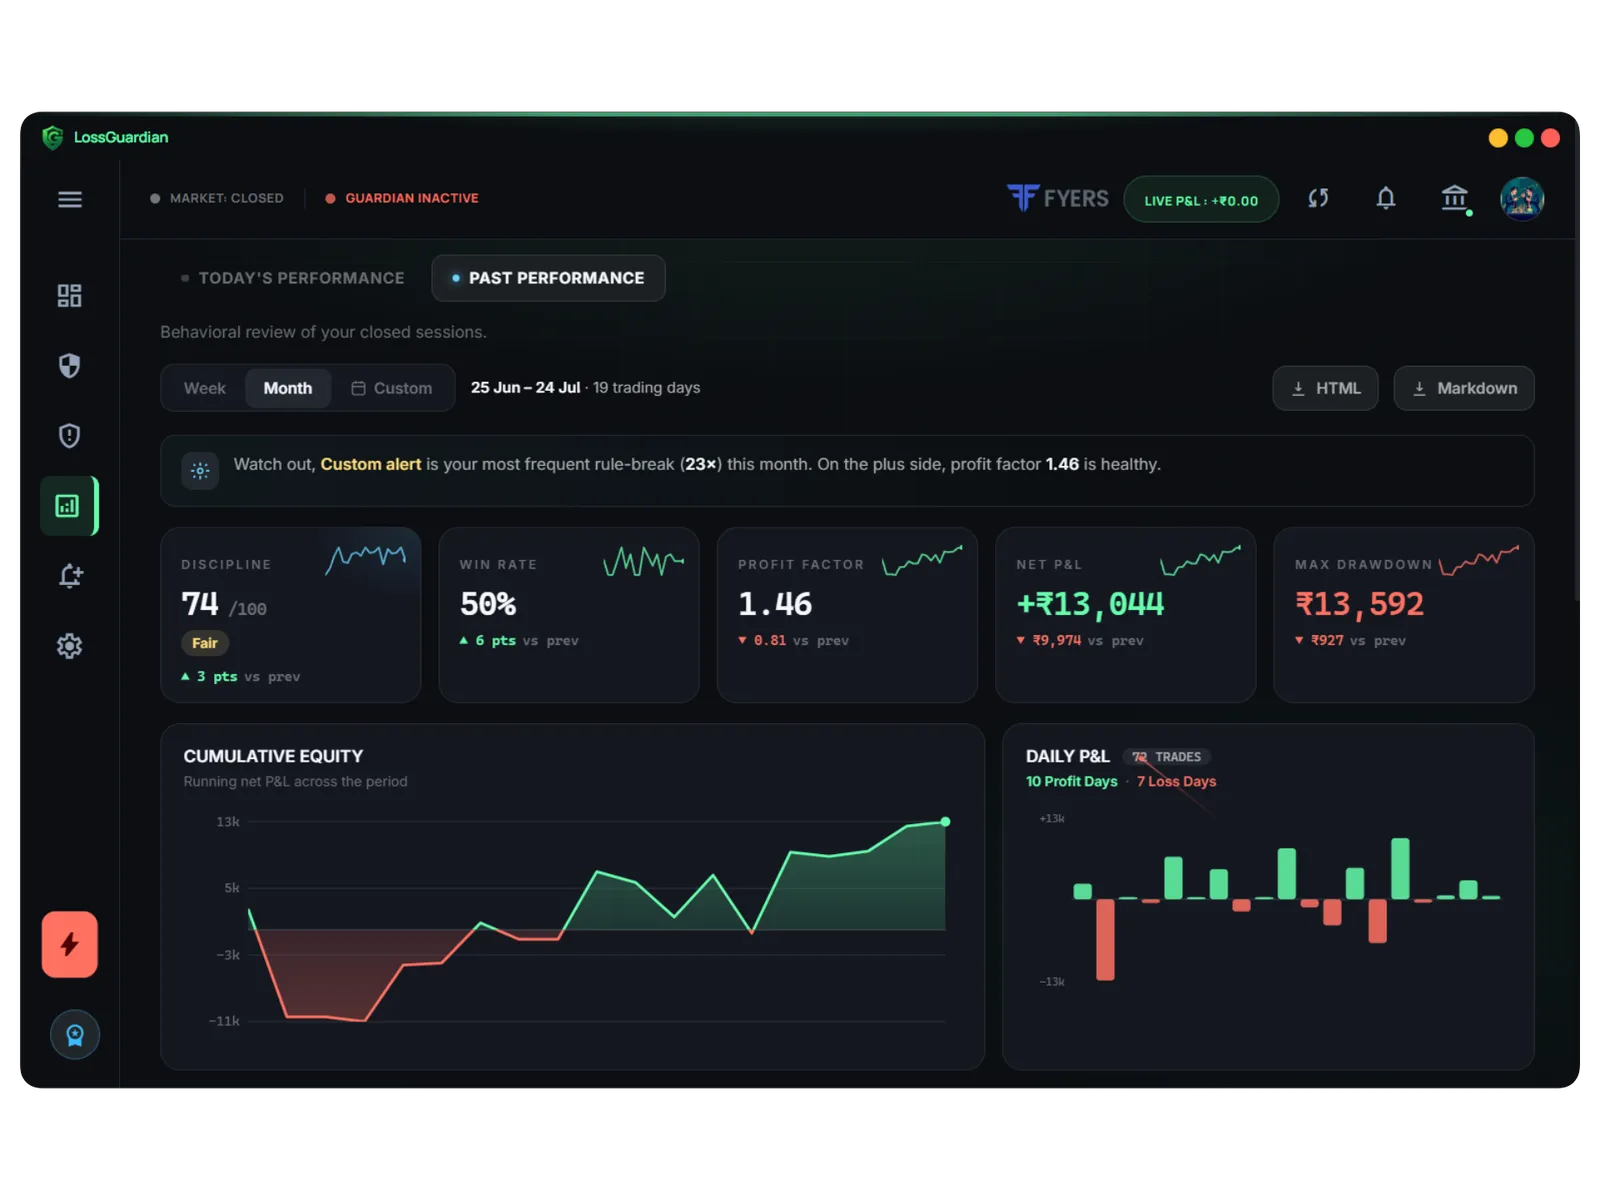
Ask a struggling trader how their month went and you will hear a feeling. "Bad." "Could have been better." "The market was tough."
Ask a profitable trader the same question and you will hear numbers. "Profit factor 1.4. Two big red days, both after 2 PM. I took too many trades on expiry."
That is the real difference between them. Not a secret strategy. The profitable trader knows exactly what they are doing wrong, because they look at their data.
The good news is that you already have the data. Every trade you take is recorded by your broker. Most traders just never look at it properly.
Your memory is lying to you
We remember our trades wrong. Not on purpose. It is just how memory works.
You remember the brilliant trade that made ₹8,000. You forget the four small revenge trades that lost ₹9,000 the same afternoon. You remember that Tuesday was a bad day. You forget that it was bad because you took 14 trades.
Data does not forget. It shows you what happened, not what you think happened. That is uncomfortable at first. It is also the fastest way to improve.
The five numbers that matter
1. Net P&L, after charges
Obvious, but check it after brokerage, STT, exchange fees and GST. Many traders are profitable before charges and losing after them. If you trade a lot, charges alone can be the difference.
2. Win rate
The share of your trades that made money. Useful, but only next to the next number. A 70% win rate means nothing if your few losses are huge.
3. Profit factor
Your total profit on winning trades divided by your total loss on losing trades. Above 1 means you are making money. Below 1 means you are losing it. It is one of the most honest numbers in trading, because it combines how often you win with how much.
In the screenshot above the profit factor is 1.46. That means for every ₹100 lost on bad trades, ₹146 came back on good ones.
4. Max drawdown
The biggest fall from a high point to a low point in your account. This tells you how painful the bad stretches are. A strategy with a smaller drawdown is easier to stick with, because you are less likely to panic and change everything after a bad week.
5. Your discipline score
This is the number most traders never track. It measures how well you followed your own rules, separate from whether you made money.
Why does that matter? Because you can break every rule and still finish green on a lucky day. And you can follow every rule and finish red on a normal losing day. If profit is the only thing you track, you learn the wrong lesson from both.
In LossGuardian every session starts at 100. Points come off for things like trading straight after a loss, crossing your trade limit, or opening a trade after your cutoff time. You see exactly which rule cost you what.
Find the mistake you repeat most
Numbers tell you how you did. The next step tells you why.
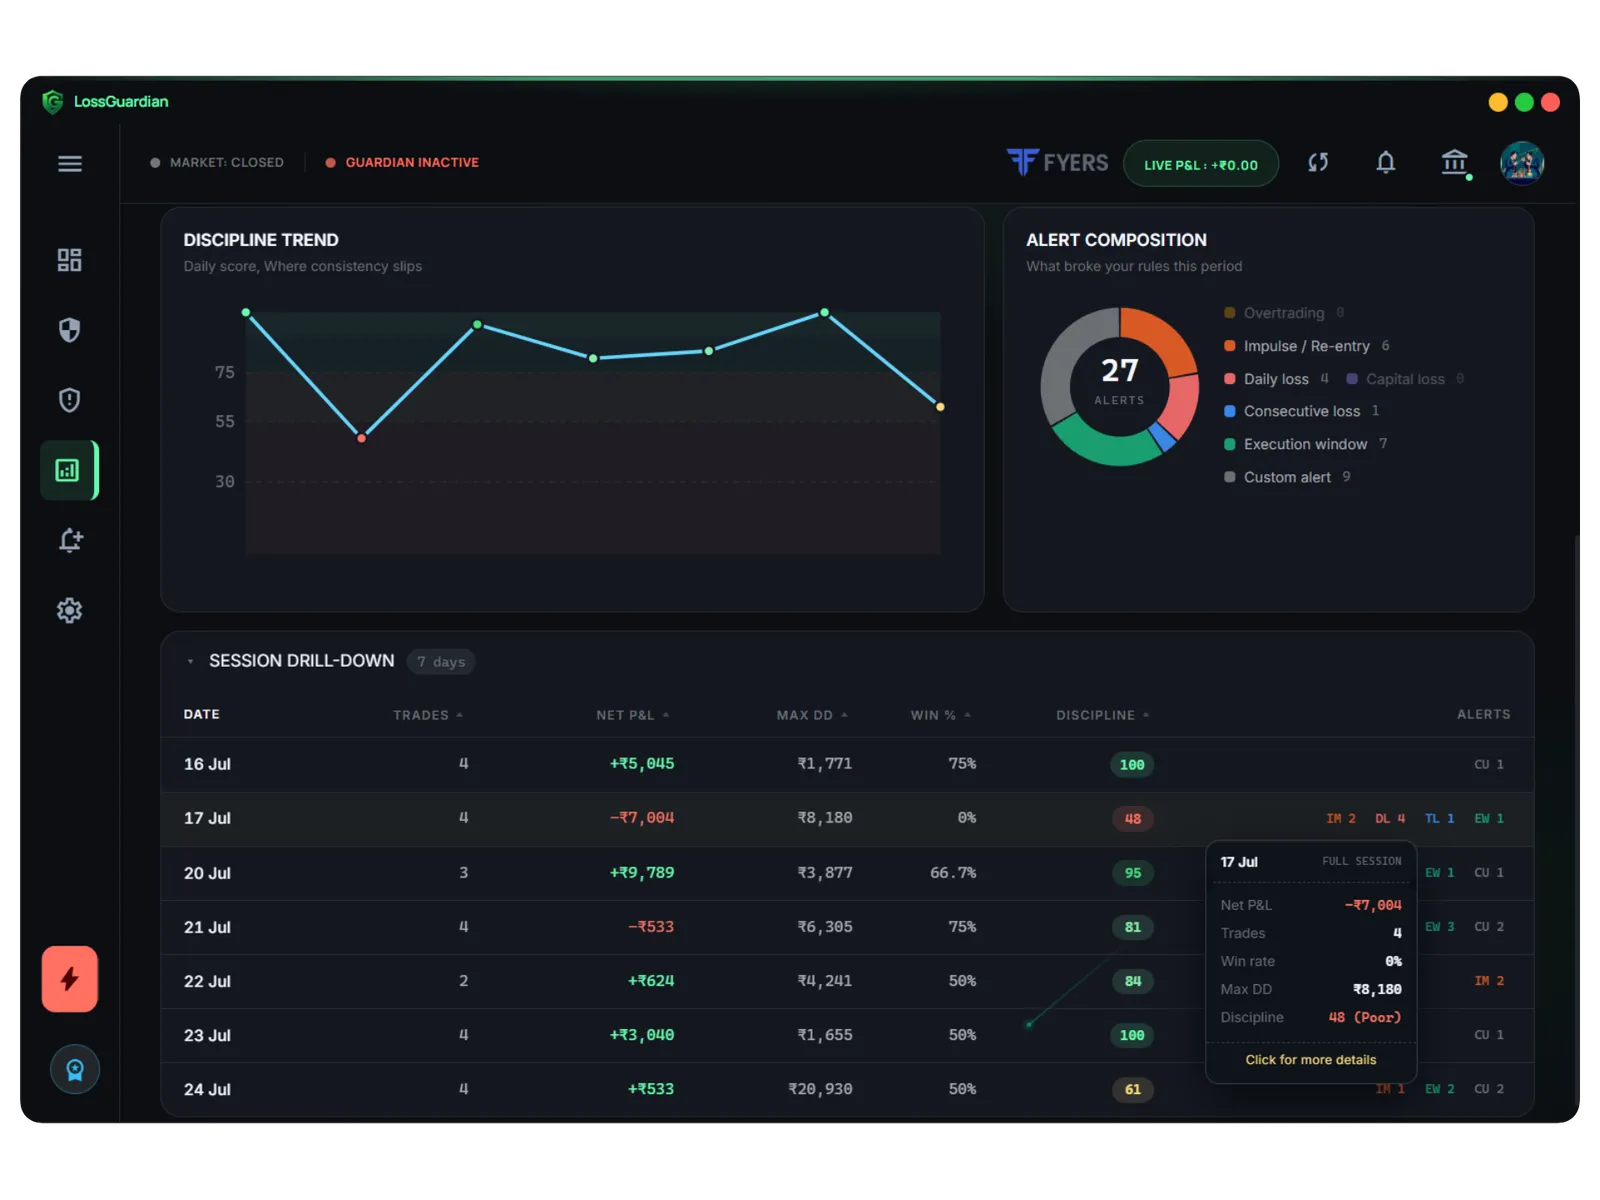
Look at the chart on the right in the image above. It shows which rules were broken over the period. Impulse re-entries, execution window, daily loss, custom alerts. Every alert you received is counted.
Now look at the table below it. Each row is one day, with its trades, P&L, drawdown, win rate and discipline score. Notice the worst day by P&L is also the day with the lowest discipline score and the most rule breaks. That is not a coincidence. It almost never is.
This is the exercise we recommend once a week:
- Find the rule you broke most often. Not the one you feel worst about. The one with the biggest count.
- Add up what those trades cost you. Put a rupee number on the habit.
- Fix only that one thing next week. One rule. Tighten the alert for it, or add a custom alert with a message to yourself.
- Check the count again next week. Did it go down? Did the P&L on those days improve?
Most traders try to fix everything at once and fix nothing. One habit a week is slow. It is also how real change happens. Twelve weeks, twelve fewer bad habits.
Watch the trend, not the day
A single day tells you very little. Markets are random in the short run. A good process can lose on any given day.
What matters is the direction over weeks. Is your discipline score slowly climbing? Is your profit factor holding above 1? Are your worst days getting smaller?
When your worst days get smaller, profits take care of themselves. The good days were never the problem. The bad days were eating them.
Make it easy or you will not do it
Reviewing trades by hand from a broker tradebook takes an hour or more. Most people do it for two weeks and stop.
That is why LossGuardian builds all of this for you from your broker data: the equity curve, the day by day drill-down, the rule breaks, the discipline trend. It can even score past days from your tradebook when the app was not running. You can export any session as a simple file to keep in your journal, or paste into an AI assistant and ask what patterns it sees.
Your data stays on your computer. Nobody else sees it.
The data is on your side
Looking at your own mistakes is not fun. But every trader who became consistent did some version of this. They stopped guessing and started measuring.
Your data is not judging you. It is the most honest trading coach you will ever have, and it is free. You just have to look.
If you want to catch mistakes as they happen and not only at the weekend, how trading alerts help you catch your mistakes is the other half of this. And if impulse re-entries top your list, start with how to stop revenge trading.
Questions traders ask
What should I track in my trading journal?
Start with five numbers per week. Net P&L, win rate, profit factor, your biggest losing day, and how many times you broke each of your own rules. The last one is the most useful and the one most traders skip.
What is a good profit factor in trading?
Profit factor is your total profit on winning trades divided by your total loss on losing trades. Above 1 means you made money. Around 1.3 to 1.5 and holding steady over months is a healthy sign for most retail traders.
Is win rate important in trading?
Less than people think. You can be profitable winning only 40% of trades if your wins are bigger than your losses. Win rate only means something next to the size of your average win and average loss.
How do I find my biggest trading mistake?
Count how often you broke each rule over a month, and add up the P&L of the trades where you broke it. The rule with the biggest cost is the one to fix first. Fix one at a time.
Does LossGuardian share my trading data?
No. Your trading history is stored on your own computer, not on our servers. It is scoped per broker account, so two accounts never mix.
LossGuardian watches your positions across six Indian brokers and warns you the moment you cross your own daily loss limit. It is read-only: it never places, modifies or cancels an order.
Join the waitlist