
Risk strategy
Trading performance analysis: how to review your past trades and find your mistakes
How to analyse your trading performance: win rate, profit factor, drawdown, a day by day review and the rules you break most. See your past trades the way LossGuardian shows them.
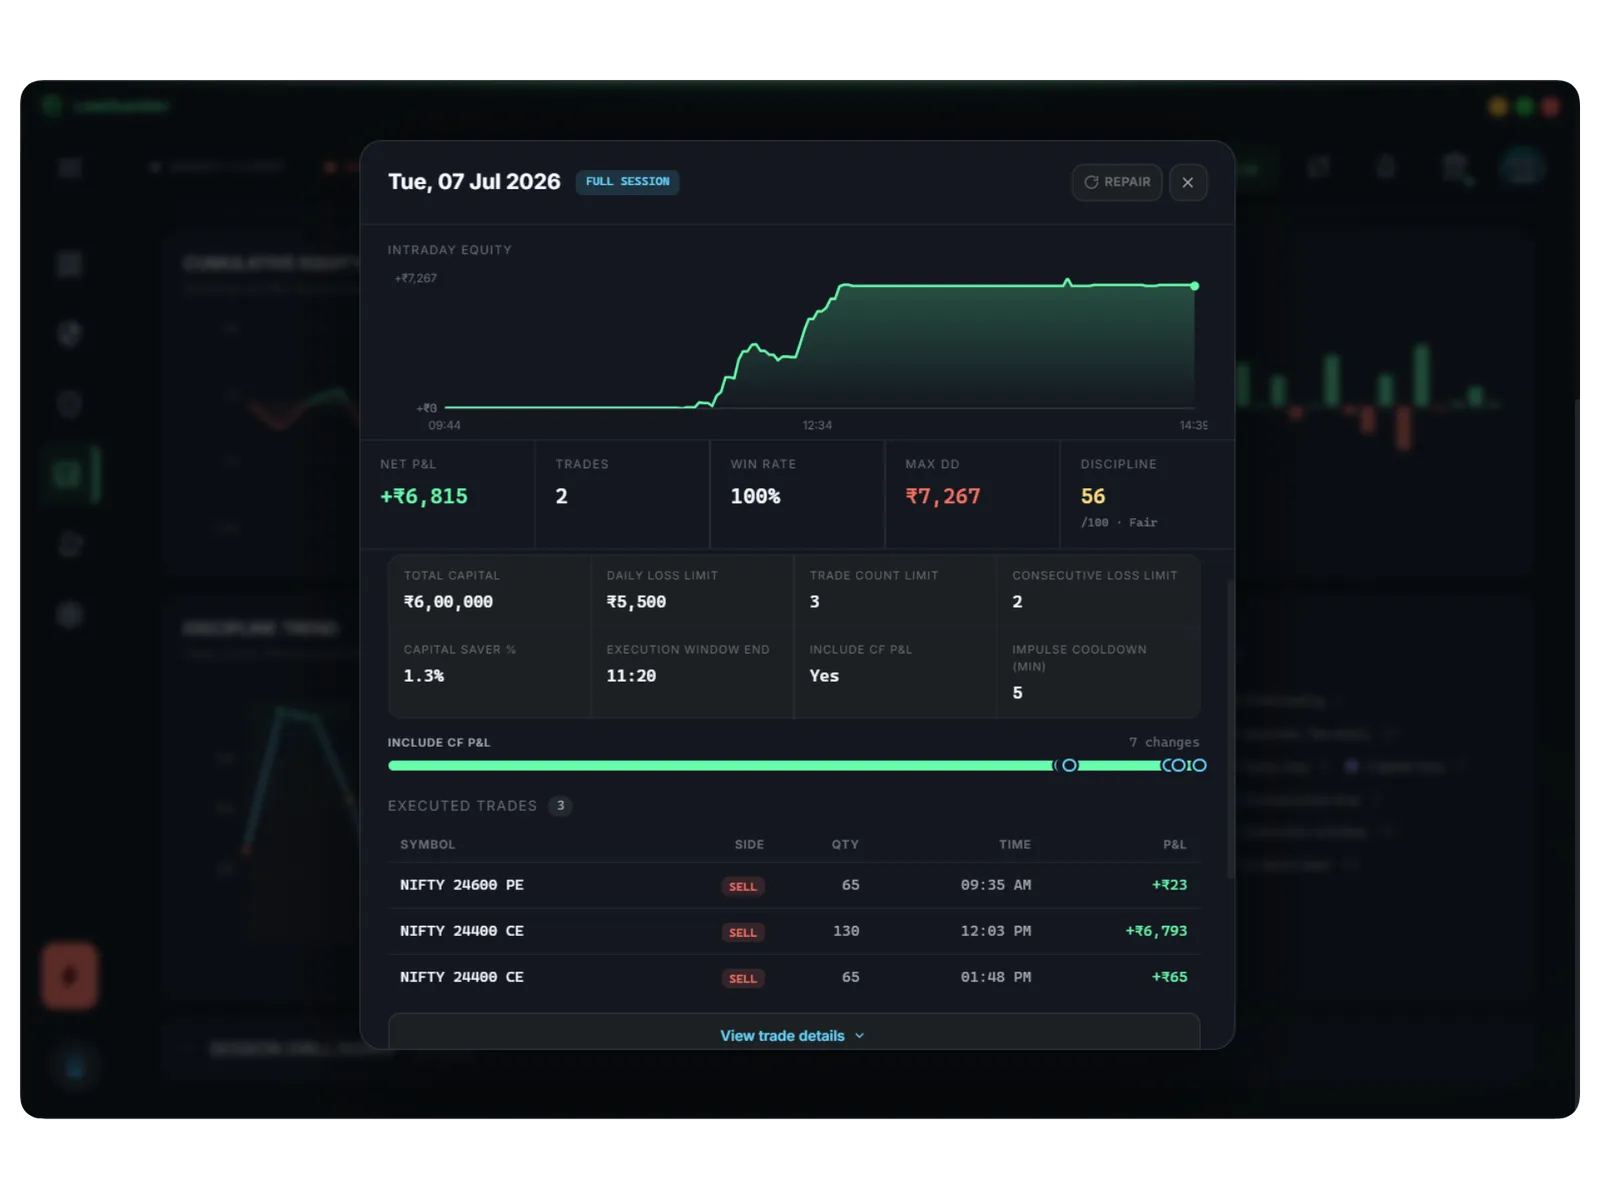
Quick answer: To analyse your trading performance, review a fixed set of numbers every week, then open your worst days and read every trade. LossGuardian builds that record for you from your broker data, and shows your exact numbers, day by day.
Most traders look at one number: profit or loss for the day. It tells you what happened. It does not tell you how you trade.
The numbers to review every week
You need only a few.
- Net P&L. The result for the period.
- Win rate. How often a trade made money.
- Profit factor. Total gains divided by total losses.
- Max drawdown. The biggest fall from a peak. LossGuardian shows two kinds, from closed trades and including open positions.
- Discipline score. How well you followed your own rules.
Win rate alone can mislead. You can win seven trades in ten and still lose money if the three losses are large.
Open a day, not just a total
A weekly number hides the story. The story is in a single day.
Open any day and you see:
- The intraday equity curve, so you can spot where the day turned.
- Net P&L, trades, win rate, drawdown and discipline.
- The risk rules you had set that day, such as your loss limit and trade limit.
- Every executed trade.
If you changed a limit during the day, that shows too. Loosening your own rules mid-session is easy to spot afterwards.
Find the rules you break
This is where it gets personal.
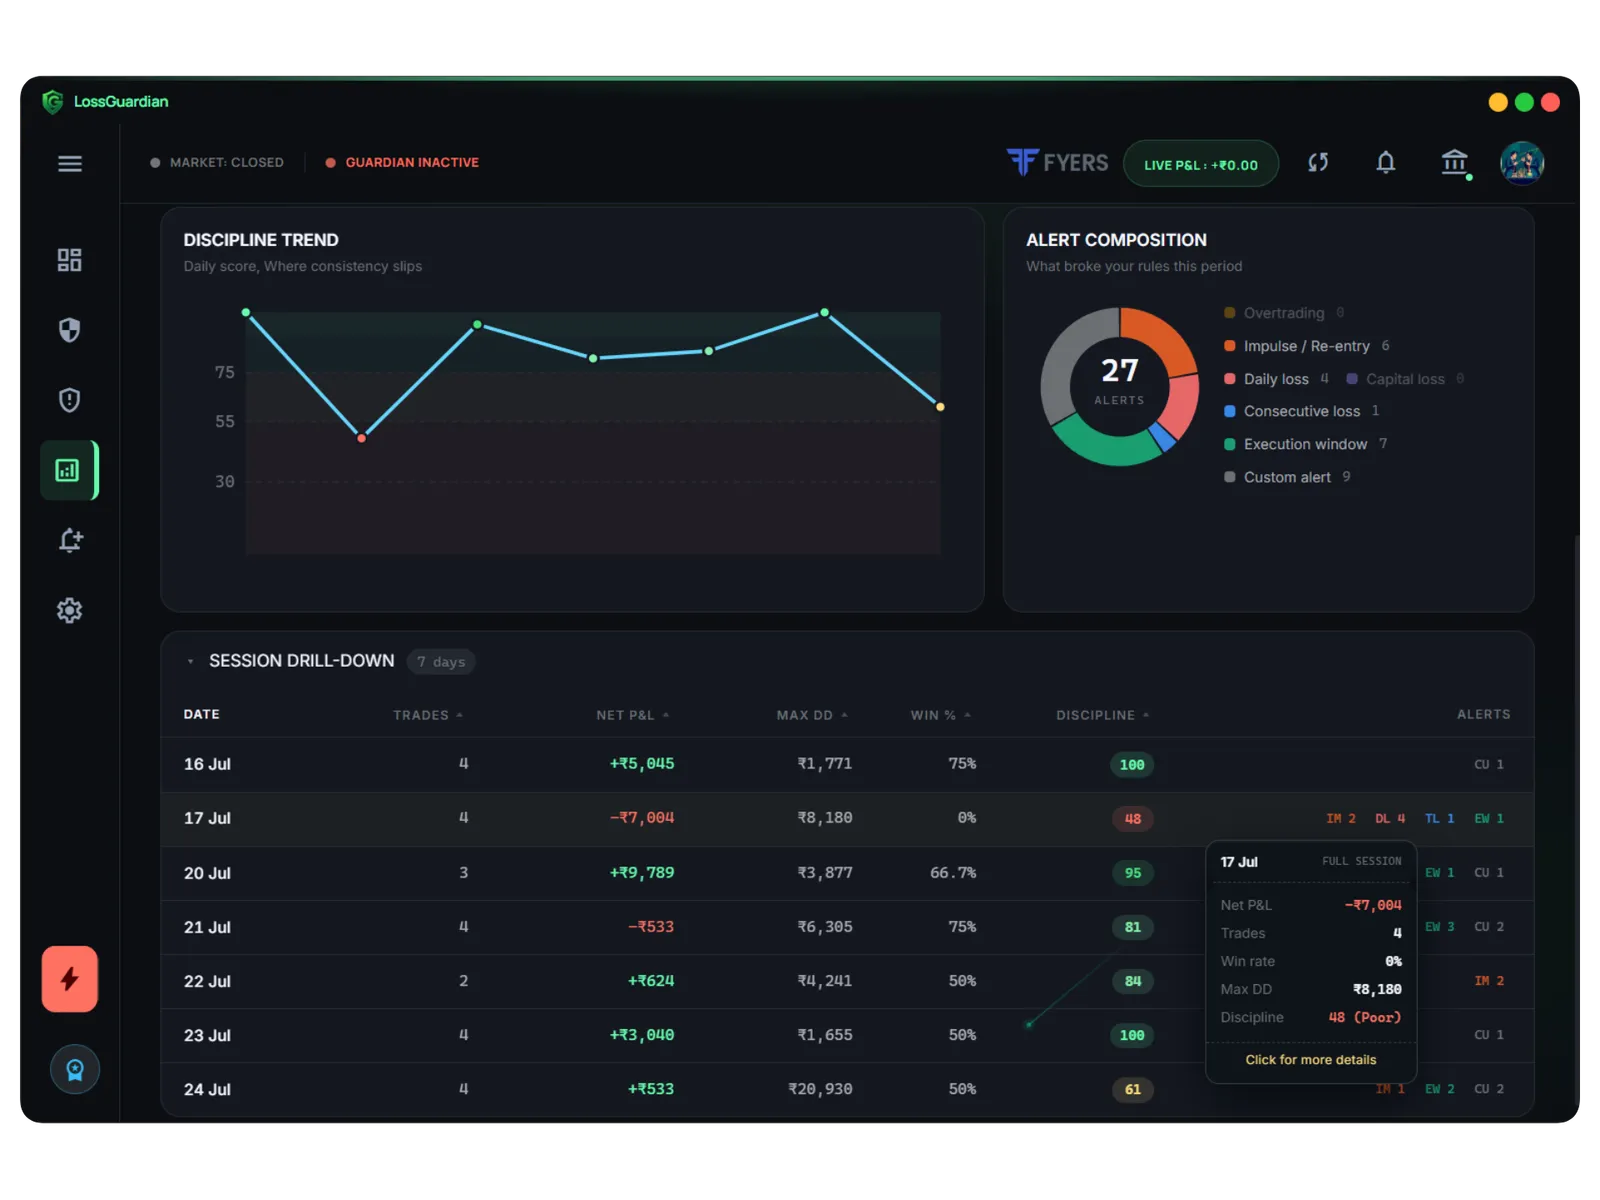
The discipline trend shows when your score slipped. The alert breakdown shows what broke your rules in the period: overtrading, impulse re-entry, daily loss, consecutive losses or trades outside your window.
Now you know exactly where you go wrong, not where you think you do.
A simple weekly review
Fifteen minutes is enough.
- Check your net P&L, win rate and profit factor for the week.
- Find your worst day and open it. Read every trade.
- Look at the alert breakdown. Which rule did you break most?
- Choose one thing to change next week. Only one.
- Look at your weekdays. Is one of them costing you? Read which day is best to trade.
Why this is what makes you consistent
You do not become a steady trader by copying someone else's style. You become one when you know your own record: your hours, your habits and your repeat mistakes.
Your numbers are your own. Past results do not predict the future, but they show you what to fix.
Where to go next
- A longer guide: trading analytics to find your mistakes.
- What the numbers say: what your trading journal is telling you.
- Your score explained: what is a trading discipline score.
You can try LossGuardian free for 10 days, no card needed. Download it here.
Questions traders ask
How do I analyse my trading performance?
Look at five things for a week or a month: net P&L, win rate, profit factor, max drawdown and the rules you broke. Then open your worst days and read every trade. Numbers show what happened. The day by day view shows why.
What is profit factor in trading?
Total gains divided by total losses. Above 1 means your wins are bigger than your losses overall. It is more honest than win rate alone.
How does LossGuardian show my past trading performance?
It builds your record from your broker data. You see net P&L, win rate, profit factor, drawdown, an equity curve and a discipline score. You can open any day to see its equity curve, every trade and the rules you had set that day.
How often should I review my trades?
A short look every day, and a proper review once a week. Pick one thing to fix, not ten.
Is my trading data stored on my computer?
LossGuardian keeps your trading record on your computer.
LossGuardian watches your positions across six Indian brokers and warns you the moment you cross your own daily loss limit. It is read-only: it never places, modifies or cancels an order.
Download LossGuardian