
Risk strategy
Win rate vs risk reward: which matters more? (a simple rupee guide)
What is a good win rate in trading? The number alone tells you very little. Risk reward ratio explained with plain rupee examples, and how your win rate, average win and average loss fit together.
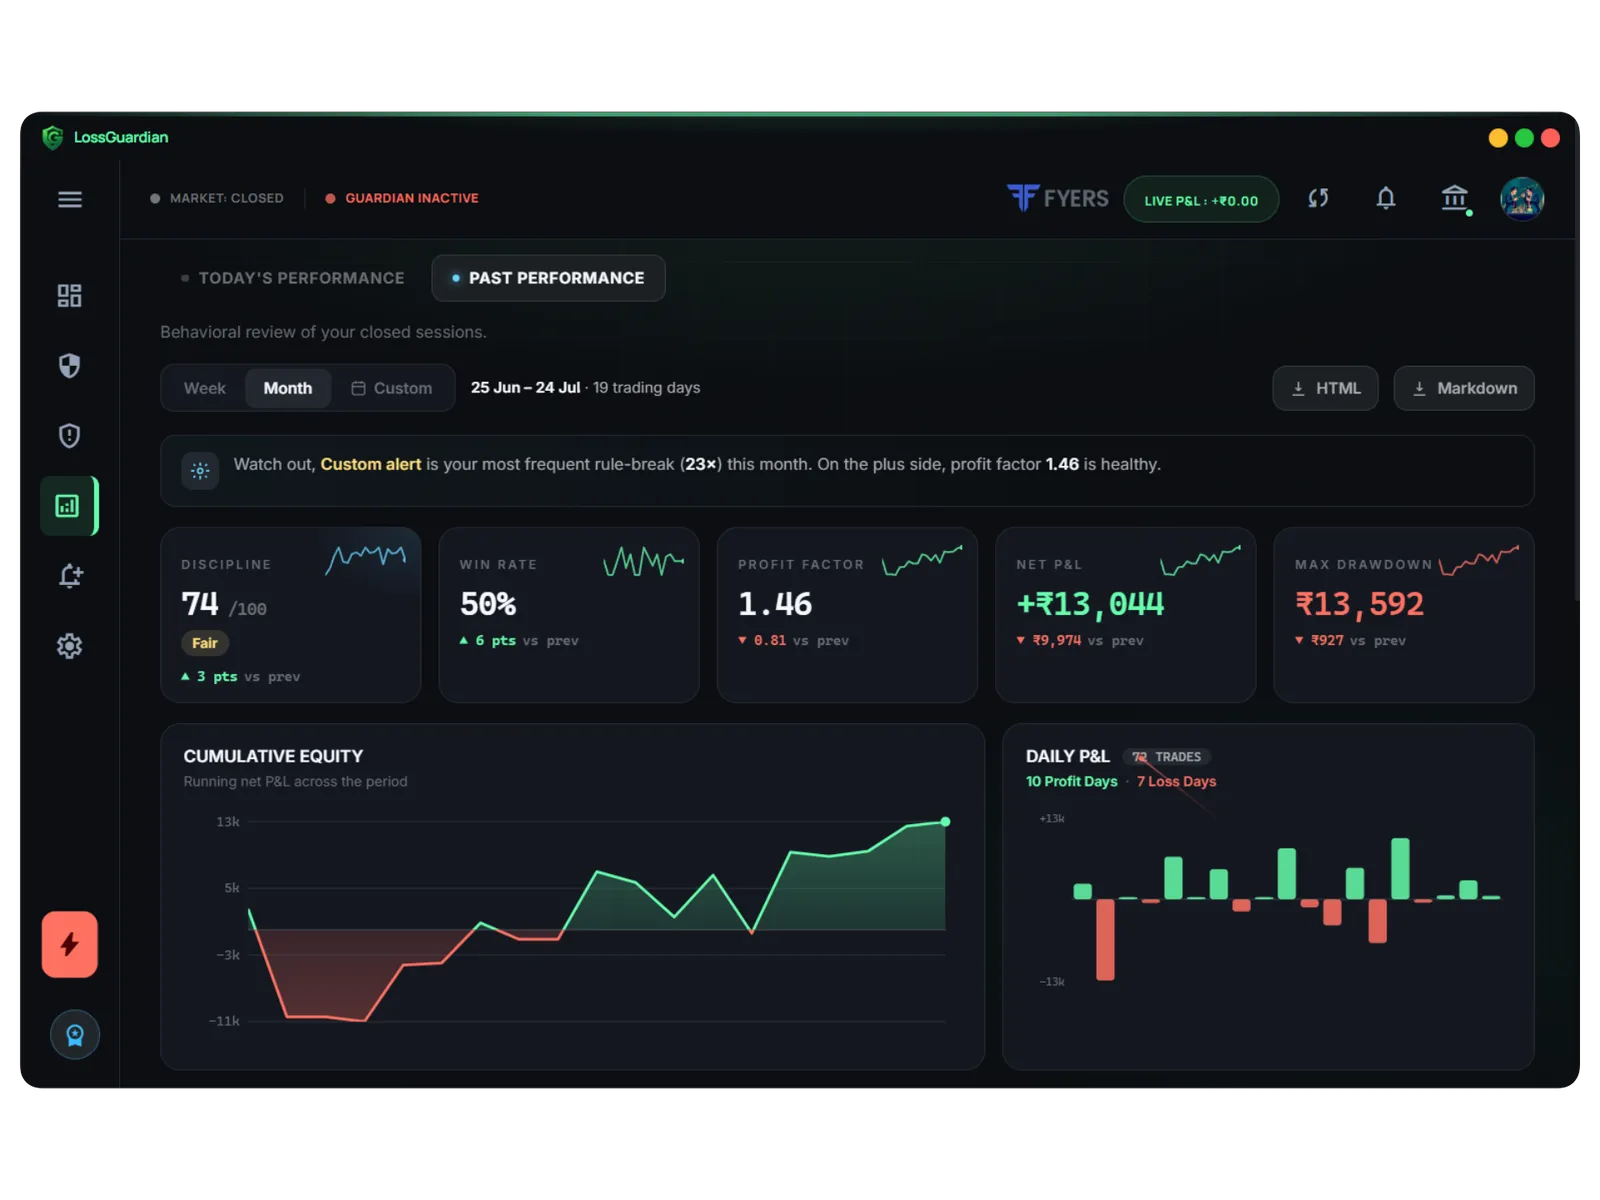
Quick answer: a win rate on its own tells you almost nothing. What you make or lose depends on three things together: how often you win, how much you make when you win, and how much you lose when you are wrong. Of these, the loss is the one you can fix before you enter a trade.
You may have asked yourself what a good win rate is. It is a fair question. But it is a bit like asking what a good speed is, without saying how far you need to go.
This article is about how the numbers fit together. If you want the wider picture first, read why risk management matters more than your strategy. Here we go deeper on one part of it.
Why win rate misleads
Win rate is easy to feel. Seven winning trades out of ten feels good. Four out of ten feels bad.
But the win rate counts trades. It does not count rupees. Your account is in rupees.
Two examples. These are made-up numbers to show the maths. They are not real results.
Example 1. You win 7 trades out of 10. Each win makes ₹1,000. Each loss costs ₹5,000.
- 7 wins: ₹7,000
- 3 losses: ₹15,000
- After 10 trades: a loss of ₹8,000
Example 2. You win only 4 trades out of 10. Each win makes ₹3,000. Each loss costs ₹1,000.
- 4 wins: ₹12,000
- 6 losses: ₹6,000
- After 10 trades: a gain of ₹6,000
The first person is right more often and ends up poorer. The second is wrong more often and ends up ahead. The win rate did not decide that. The size of the wins and the losses did.
Expectancy: what an average trade gives you
There is a simple way to put the three numbers together. It is called expectancy. Do not let the word worry you. It means: on an average trade, how many rupees do you gain or lose?
Take your total after a set of trades and divide by the number of trades.
- Example 1: a loss of ₹8,000 over 10 trades is ₹800 lost on an average trade.
- Example 2: a gain of ₹6,000 over 10 trades is ₹600 gained on an average trade.
If that average is above zero, your trades together make money. If it is below zero, they lose money, however good the win rate looks.
You can also work it out from the three parts:
(win rate × average win) − (loss rate × average loss)
For example 2 that is (0.4 × ₹3,000) − (0.6 × ₹1,000). That is ₹1,200 − ₹600 = ₹600. Same answer.
The win rate you need depends on the ratio
Here is the part that surprises people. The size of your loss against your win sets the win rate you need just to break even.
The rule is: average loss ÷ (average win + average loss).
- Win ₹1,000, lose ₹5,000: you need to win 5,000 ÷ 6,000, a little over 83% of the time, just to break even. Winning 7 in 10 is not enough.
- Win ₹2,000, lose ₹2,000: you need to win half the time.
- Win ₹3,000, lose ₹1,000: you need to win 1,000 ÷ 4,000, which is 25% of the time. Winning 4 in 10 is plenty.
So a small loss with a bigger win means you can be wrong often and still be fine. A big loss with a small win means you have to be right almost every time. That is a hard way to trade, because nobody is right almost every time.
Risk reward ratio explained
The risk reward ratio is the same idea, written before the trade.
You decide where you will exit if you are wrong. That gives you the risk. You decide where you hope to exit if you are right. That gives you the reward. If you risk ₹1,000 to try to make ₹3,000, the ratio is 1 to 3.
Two things to remember.
First, the ratio is a plan. The market may not give you the reward. Your trades will show whether your plan matches what really happened.
Second, the two sides are not equal. The reward is a hope. The risk is something you set. You choose the exit before you enter, and you choose how many lots to take. A bigger reward target does not make a trade safer if the loss side is loose.
That is why this article keeps coming back to the loss.
The number you control is the loss
You cannot make the market pay you more. You can decide how much one trade is allowed to cost you.
In practice that means three small decisions.
- Where you exit if wrong. Decide it before you enter, not after the price starts moving against you.
- How big you trade. The same exit point costs very different rupees at different sizes. The position size calculator shows the rupee risk of a size before you take it, and position sizing for Nifty options has worked examples.
- How much a day may cost you. One bad trade should not turn into five. A daily loss limit puts a ceiling on the day. The loss limit calculator helps you pick a number.
If this sounds like a lot, it is the same idea at three sizes: one trade, one position and one day. The full routine is in how to manage risk in trading.
How to find your own numbers
Everything above is arithmetic on your own trades. So the useful step is to look at your real ones.
You need four things.
- Win rate. The share of your trades that made money.
- Average win. What a winning trade makes you, on average, in rupees.
- Average loss. What a losing trade costs you, on average, in rupees.
- Profit factor. How much you win for every rupee you lose. Above 1 means your wins are bigger in total than your losses. Below 1 means the opposite.
Doing this by hand from a contract note is slow, and it is easy to stop after a week.
LossGuardian reads your trades from your broker, so there is nothing to type. The Trade Log shows your win rate, your max drawdown, your current streak and your profit factor, with every executed trade listed under them with its P&L.
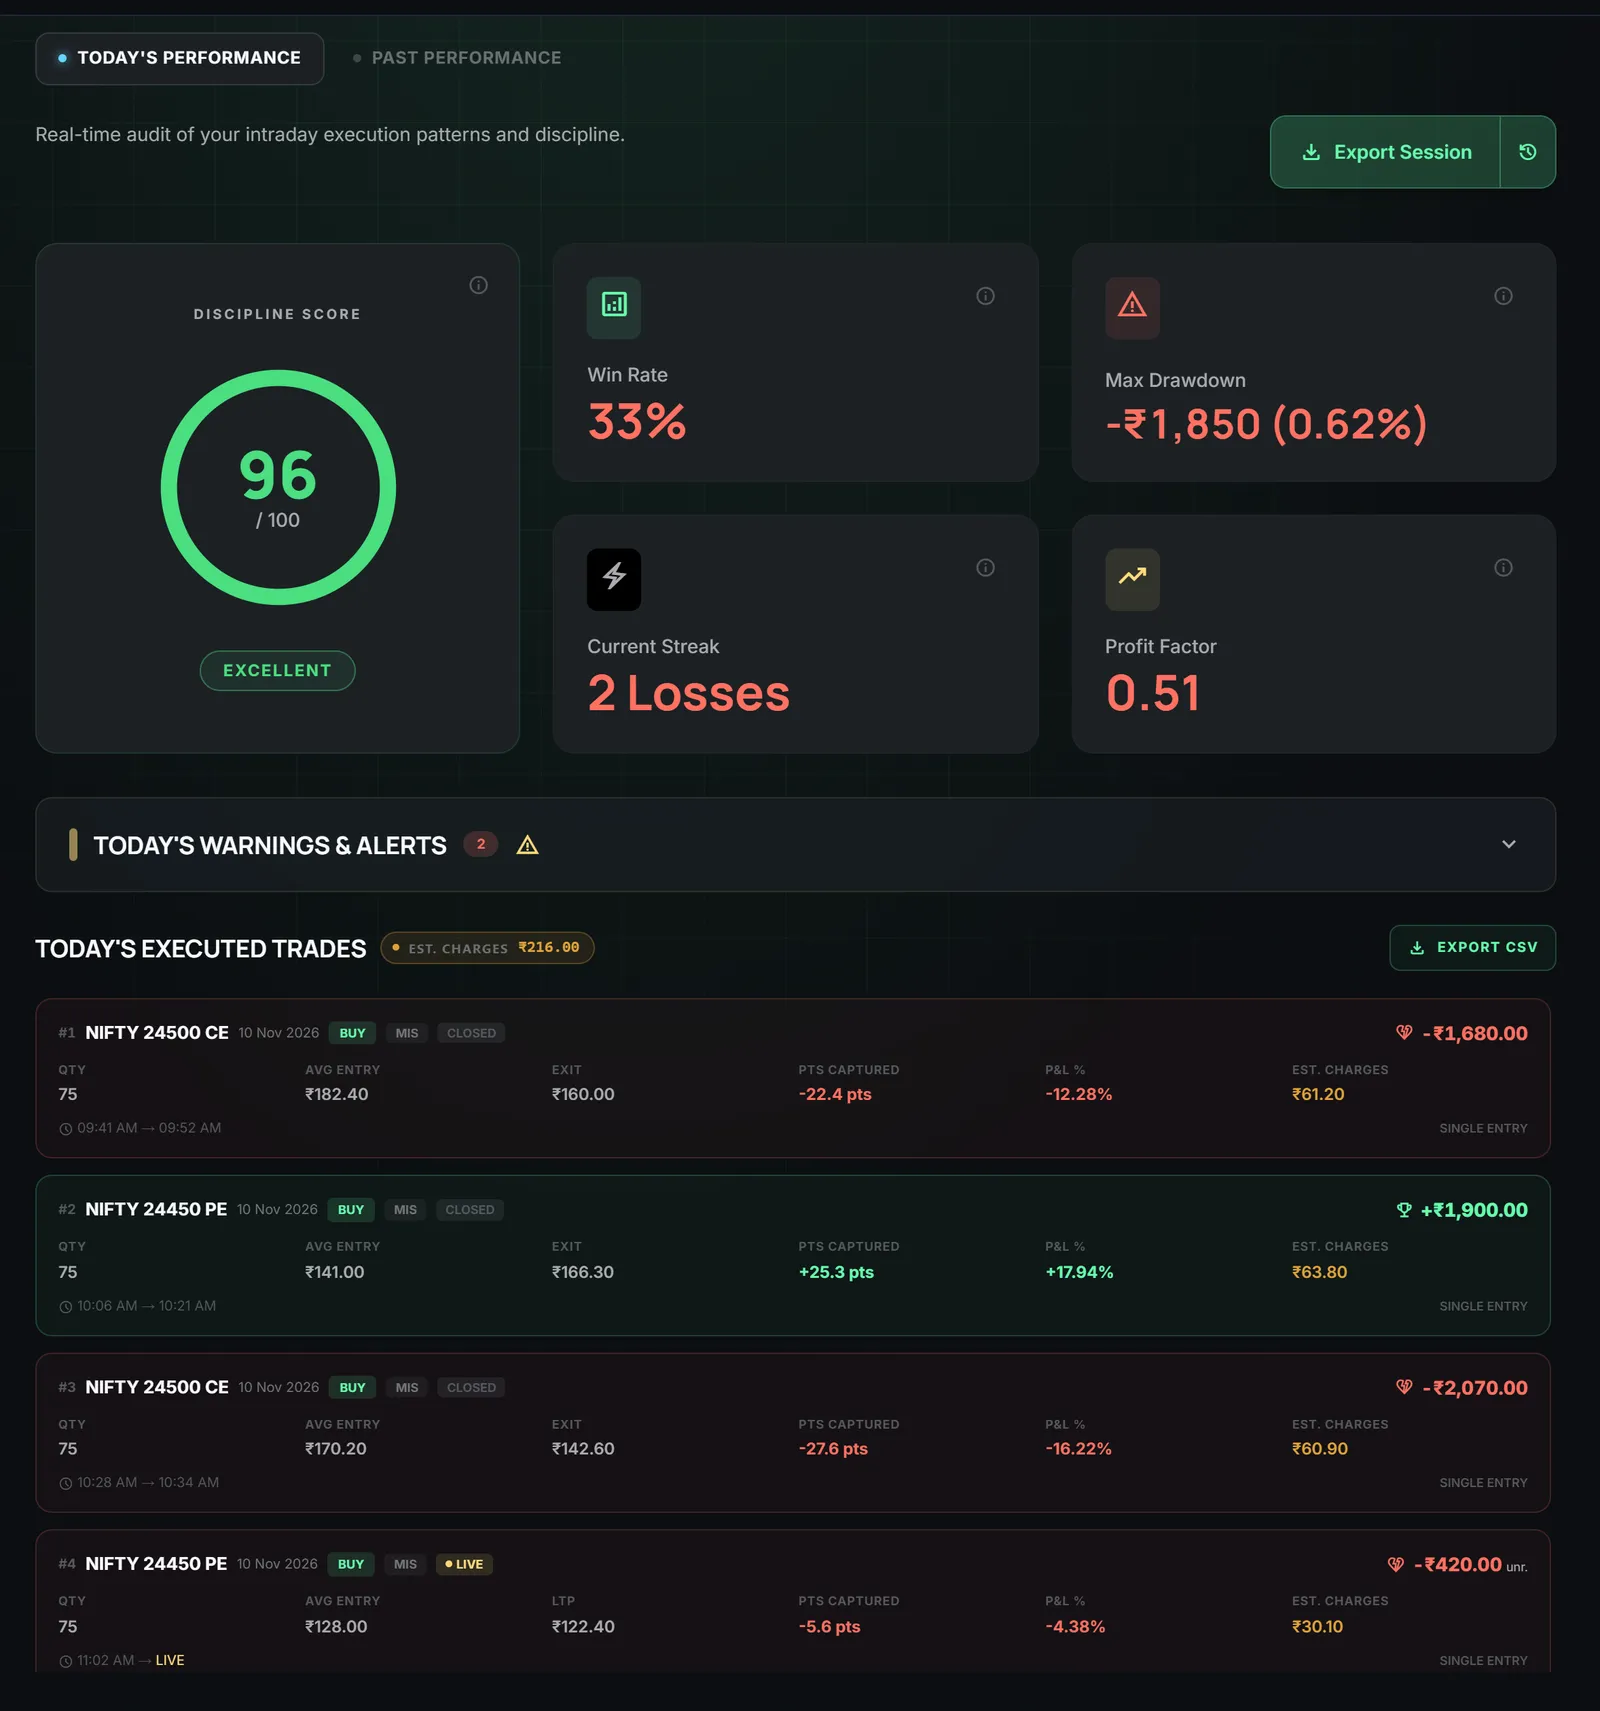
Look at this one day. Win rate and profit factor are at the top. Under them, each trade shows its own P&L, so you can see which trades were wins and how big each loss was. One day says little by itself. It is the habit of looking that matters.
For a longer view, open Past performance. It covers a week, a month or a range you choose, with your win rate, profit factor, net P&L and drawdown, plus your cumulative equity and daily P&L.
Your average win and average loss are not shown as separate cards. You can work them out from the trade list, or from Export Session, which saves the day as a file. Add up the winners and divide by how many there were. Do the same for the losers. Then you have all three numbers. The guide has more on reading the Trade Log and analytics, and how to use analytics to find your mistakes goes through what to look for.
What to do with what you find
Look at two things.
Is your average loss bigger than your average win? If yes, you may be right often and still lose money. Do not try to fix this by chasing a higher win rate. Work on the loss: the exit, the size, the limit.
Is your profit factor below 1? Your losses are bigger in total than your wins. Same answer.
Change one thing at a time. Check again after a few weeks of trades. If your losses grow after a bad run, consecutive losses in trading covers that.
Where LossGuardian helps
Once you know your numbers, the next step is to cap the loss side. In Risk Manager you set your rules before the market opens.
- Today's loss limit: your daily loss limit in rupees. You get a warning on the way and a hard stop when you reach it.
- Capital Saver limit: the most of your capital you can lose in a day, as a percentage. When it breaks, the day is over.
- Daily trade limit: the most trades you take today.
- Consecutive loss limit: warns you after this many losses in a row.
These do not change how often you win. They keep a bad day from growing past the loss you planned for. The Risk Manager guide explains each field.
LossGuardian is read-only. It never places, changes or cancels an order and never closes a position. It watches your own limits and tells you when you reach them. The trades are still yours.
A calm way to think about it
You do not need a high win rate. You need a loss you can live with, and wins that are not much smaller than it.
Write down your four numbers. Look at them once a week. If the loss side is too big, make it smaller before you try anything else. Over time, the habit does the work, and you may need the screens less.
Questions traders ask
What is a good win rate in trading?
There is no single number that is good on its own. A win rate only means something next to your average win and your average loss. Some people win less than half their trades and do well. Some win most of their trades and still lose money.
What is a risk reward ratio?
It compares how much you risk on a trade with how much you hope to make. If you risk ₹1,000 to try to make ₹3,000, the ratio is 1 to 3. It is a plan for one trade. What you actually made and lost is in your trade history.
Which matters more, win rate or risk reward?
Neither works alone. Together they decide whether you make money over many trades. The loss is the part you can set before you enter, so that is the part to work on first.
What is expectancy in trading?
It is what an average trade gives you in rupees. You add up your wins, subtract your losses, and divide by the number of trades. If it is above zero, your trades together make money. If it is below zero, they do not.
Where can I see my win rate in LossGuardian?
In the Trade Log and Past performance screens. LossGuardian reads your trades from your broker, so there is nothing to type. Win rate and profit factor are shown there, and your trades are listed with their P&L.
Is there an app that tracks win rate and risk reward?
LossGuardian works out your win rate and profit factor from your broker trades every day and shows the trend over weeks.
LossGuardian watches your positions across six Indian brokers and warns you the moment you cross your own daily loss limit. It is read-only: it never places, modifies or cancels an order.
Download LossGuardian